Knee biomarkers in Low-field (0.55T) quantitative MRI: a comparison study with 3.0T
In recent years, low-field (0.55T) MRI scanners have experienced a renaissance with novel technical developments ensuring high-quality image acquisition with improved resolution, SNR, and accelerated scan time. Moreover, the 0.55T scanner offers additional advantages such as allowing safer image acquisition due to much lowered specific absorption rates (SAR) and providing higher flexibility to be installed at a broader geography due to lower weight and transportation requirements, with no quench pipe and minimal helium involved. Potential uses of 0.55T scanners have been demonstrated for brain, pulmonary, cardiac, and musculoskeletal imaging domains. Still in its early days, quantitative biomarker estimation and associated reliability have not been explored in-depth for the musculoskeletal system, particularly for knee OA. There is a potential to utilize the existing DL algorithms out-of-the-box, which are extensively validated at higher-field strengths for specific tasks, for application in lower-field. In the current study, our purpose is to evaluate the feasibility of applying deep learning (DL) enabled algorithms to quantify bilateral knee biomarkers in healthy controls scanned at 0.55T and compared with 3.0T; such as Bone Shape, Cartilage Thickness, Compartment-wise cartilage T2 value, etc. We are performing an in-depth comparative analysis of quantitative values between 0.55T vs. 3.0T as well as qualitative evaluations of segmentation quality, performance, and clinical scoring with an MSK-expert radiologist. Overall, using Radial TSE T2 mapping and MR-Fingerprinting T1, T2, and PD mapping methods (in collaboration with Setsompop et al, Stanford University), we are currently evaluating the feasibility of utilizing 0.55T for quantitative parametric evaluation on a varied spectrum of normal to degenerative knee assessment.
Project members at UCSF
Yang Yang, Rupsa Bhattacharjee, Sharmila Majumdar
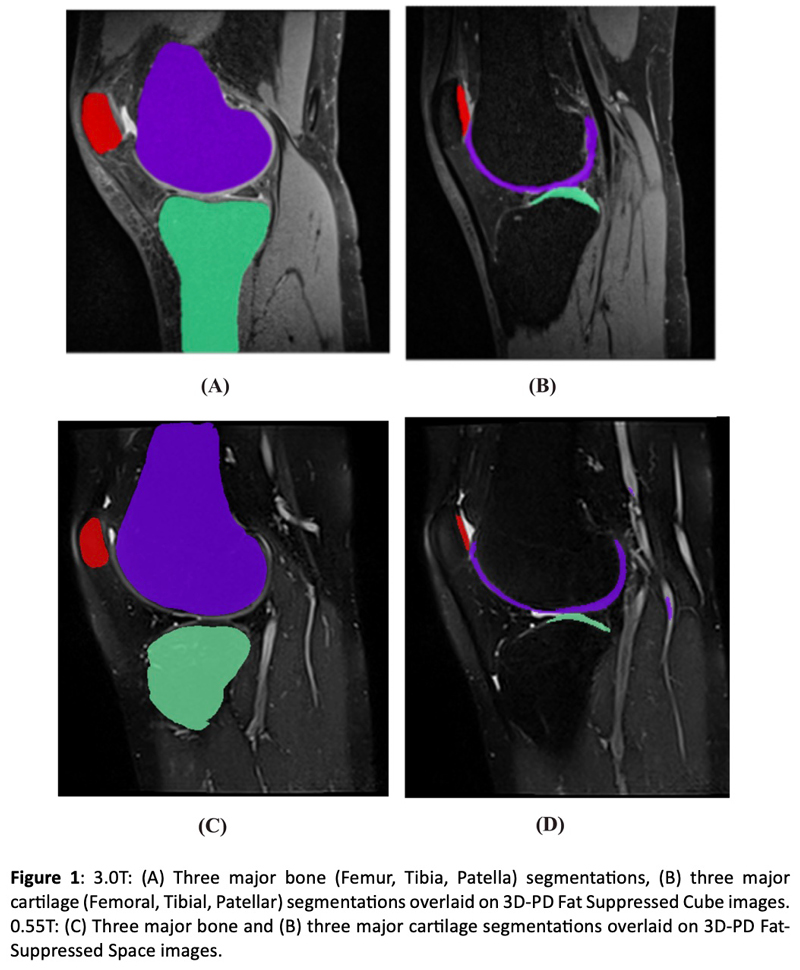
Figure 1: 3.0T (A) Three major bone (Femur, Tibia, Patella) segmentations, (B) three major cartilage (Femoral, Tibial, Patellar) segmentations overlaid on 3D-PD Fat Suppressed Cube images. 0.55T: (C) Three major bone and (B) three major cartilage segmentations overlaid on 3D-PD Fat-Suppressed Space images.
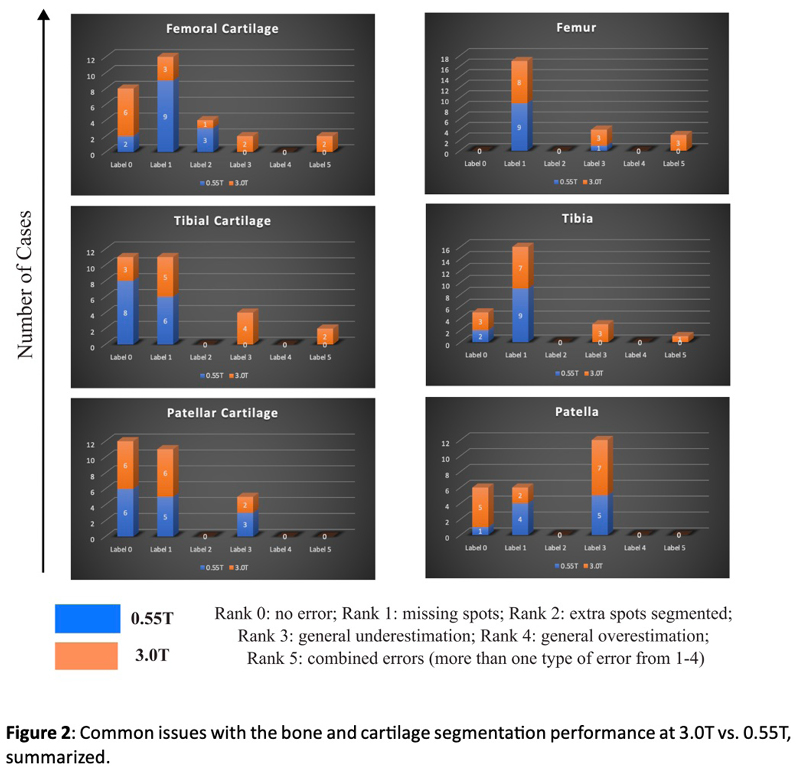
Figure 2: Common issues with the bone and cartilage segmentation performance at 3.0T vs. 0.55T, summarized.
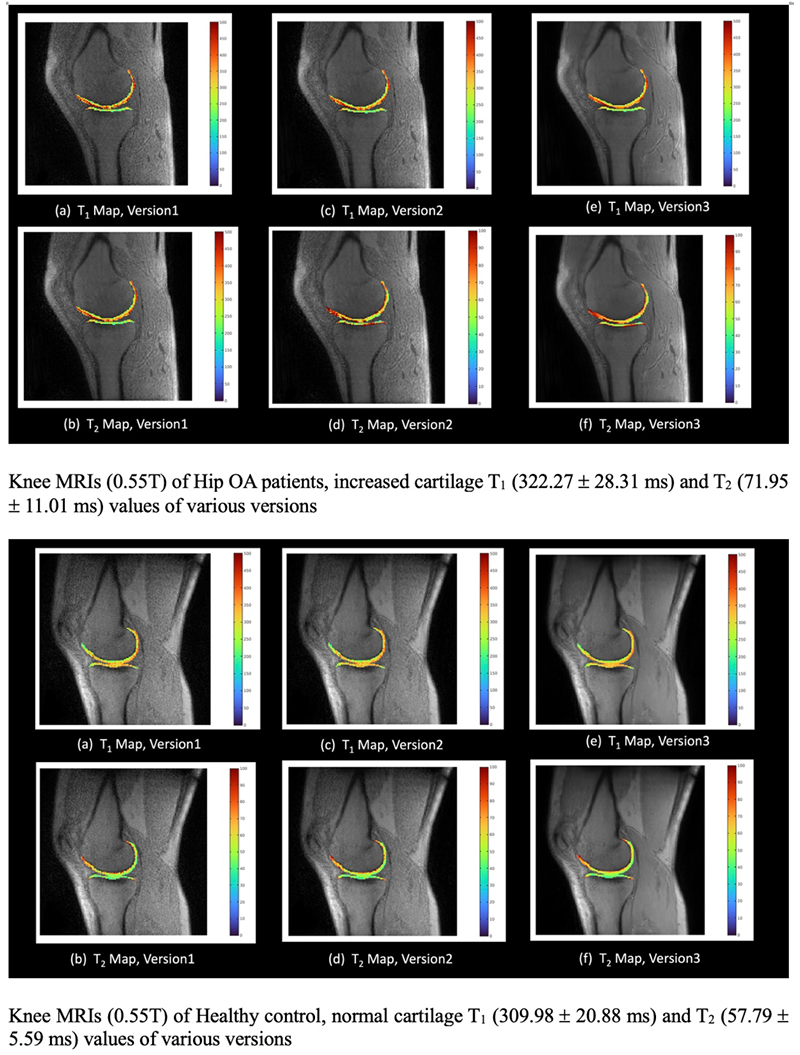
Knee MRIs (0.55T) of Hip OA patients, increased cartilage T1 (322.27 ± 28.31 ms) and T2 (71.95 ± ms) values of various versions.